oracle-ai-developer-hub
Part 7: Agent Observability
Three TODOs in This Part
Part 7 adds LangSmith tracing to the agent you built in Part 6. You will keep the original call_agent() function unchanged and create an observed wrapper that sends traces to a LangSmith project.
Before running the Part 7 notebook cells, set a LangSmith API key:
export LANGSMITH_API_KEY="lsv2_..."
export LANGSMITH_TRACING=true
export LANGSMITH_PROJECT=agent-memory-workshop
Then open your project in LangSmith:
https://smith.langchain.com
TODO 17: Configure LangSmith
LangSmith has three moving parts in this lab:
- Client - connects the notebook to LangSmith
- Project - groups traces for this workshop
- Trace runs - records parent and child operations for one agent turn
Complete solution:
import os

import langsmith as ls
from langsmith import Client

def configure_agent_observability(
    project_name: str = "agent-memory-workshop",
):
    os.environ.setdefault("LANGSMITH_TRACING", "true")
    os.environ.setdefault("LANGSMITH_PROJECT", project_name)

    if not os.environ.get("LANGSMITH_API_KEY"):
        raise RuntimeError(
            "Set LANGSMITH_API_KEY before running Part 7. "
            "Create an API key in LangSmith, then export it in your shell or set it in this notebook."
        )

    client = Client()
    return {"client": client, "project_name": project_name}

observability = configure_agent_observability()
tracer = ls
Privacy default: This lab records metadata, not content. Trace inputs, outputs, and metadata should include lengths, counts, model names, tool names, memory types, and error status - not full prompts, retrieved documents, API keys, raw tool output, or database connection strings.
TODO 18: call_agent_observed()
The original call_agent() remains your working agent harness. In Part 7, you create a second function, call_agent_observed(), that follows the same flow but wraps each major operation in LangSmith trace runs.
Trace shape:
agent.run
├── agent.context.build
│   ├── agent.memory.read conversational
│   ├── agent.memory.read knowledge_base
│   ├── agent.memory.read workflow
│   ├── agent.memory.read entity
│   └── agent.memory.read summary
├── agent.context.check
├── agent.toolbox.read
├── agent.memory.write user_message
├── agent.llm.call
├── agent.tool.execute
├── agent.tool.log
├── agent.memory.write workflow
├── agent.memory.write entity
└── agent.memory.write assistant_message
Important metadata to record:
| Field | Example | Why it is safe |
|---|---|---|
agent.thread_id |
0022 |
Identifier, not content |
query.length |
74 |
Length only |
context.estimated_tokens |
1320 |
Count only |
memory.type |
knowledge_base |
Category only |
memory.result_length |
540 |
Length only |
tool.name |
search_tavily |
Tool name only |
tool.result_length |
1800 |
Length only |
llm.model |
xai.grok-3-fast |
Model name only |
Why manual trace runs first: LangSmith can trace LangChain applications automatically, but manual runs make this notebook’s Part 6 architecture visible. Once you understand that trace, automatic instrumentation is easier to reason about.
TODO 19: Run and Inspect the Trace
Run a short observed conversation using a fresh thread ID:
observed_thread = "observed-0022"

for q in [
    "Find papers about memory in AI agents",
    "What did we just discuss?",
    "Search the web for recent agent observability ideas",
]:
    call_agent_observed(q, thread_id=observed_thread, max_iterations=5)
Then open LangSmith:
- Open
https://smith.langchain.com - Select the
agent-memory-workshopproject - Open the most recent
agent.runtrace - Expand the child runs
You should see where the agent spent time and which operations happened during the turn.
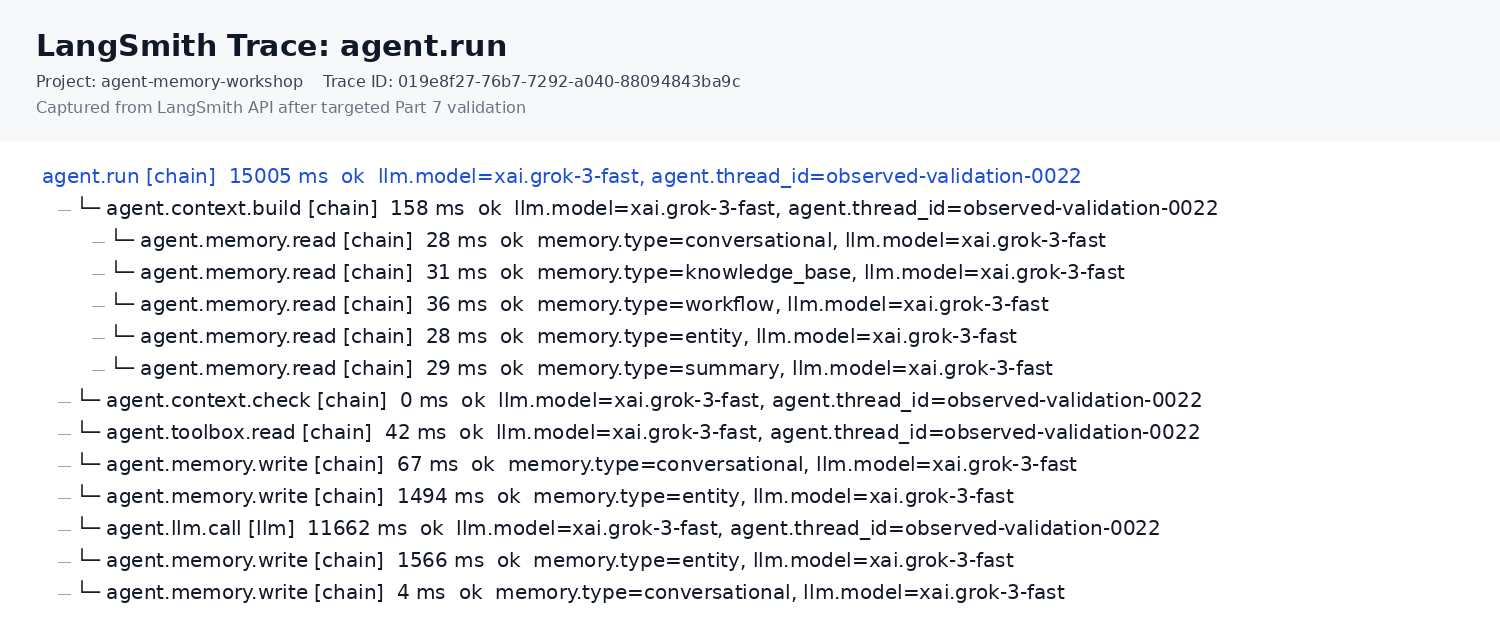
What to Look For
Context build runs: These show which memory systems were read before the LLM call.
Tool runs: These show whether the model called Tavily or summary tools.
Context check runs: These show estimated context window size without exposing the full prompt.
Memory write runs: These show the durable writes that make the next turn memory-aware.
Key Takeaways
Observability makes agent behavior inspectable. The Part 6 chart shows that the memory-aware agent controls context growth. Part 7 shows the operational path behind that chart.
The trace is not the memory store. Oracle AI Database still stores the agent’s memory. LangSmith shows what happened during execution.
Safe traces are designed. A useful trace does not need full prompts or raw tool results. In most labs and production systems, counts, names, durations, statuses, and sanitized IDs are enough to debug the flow.